I am building a database backed website through GitHub codespace and I am very new to it. I am trying to make changes to the main code (app.py) to add the database tables. When I try to run the website application on a local server the website does not render and gives me an error. The code is available at: GitHub - chirag167/leveldensities: Website for level density data.
I would appreciate it if I could get any insights in this matter.
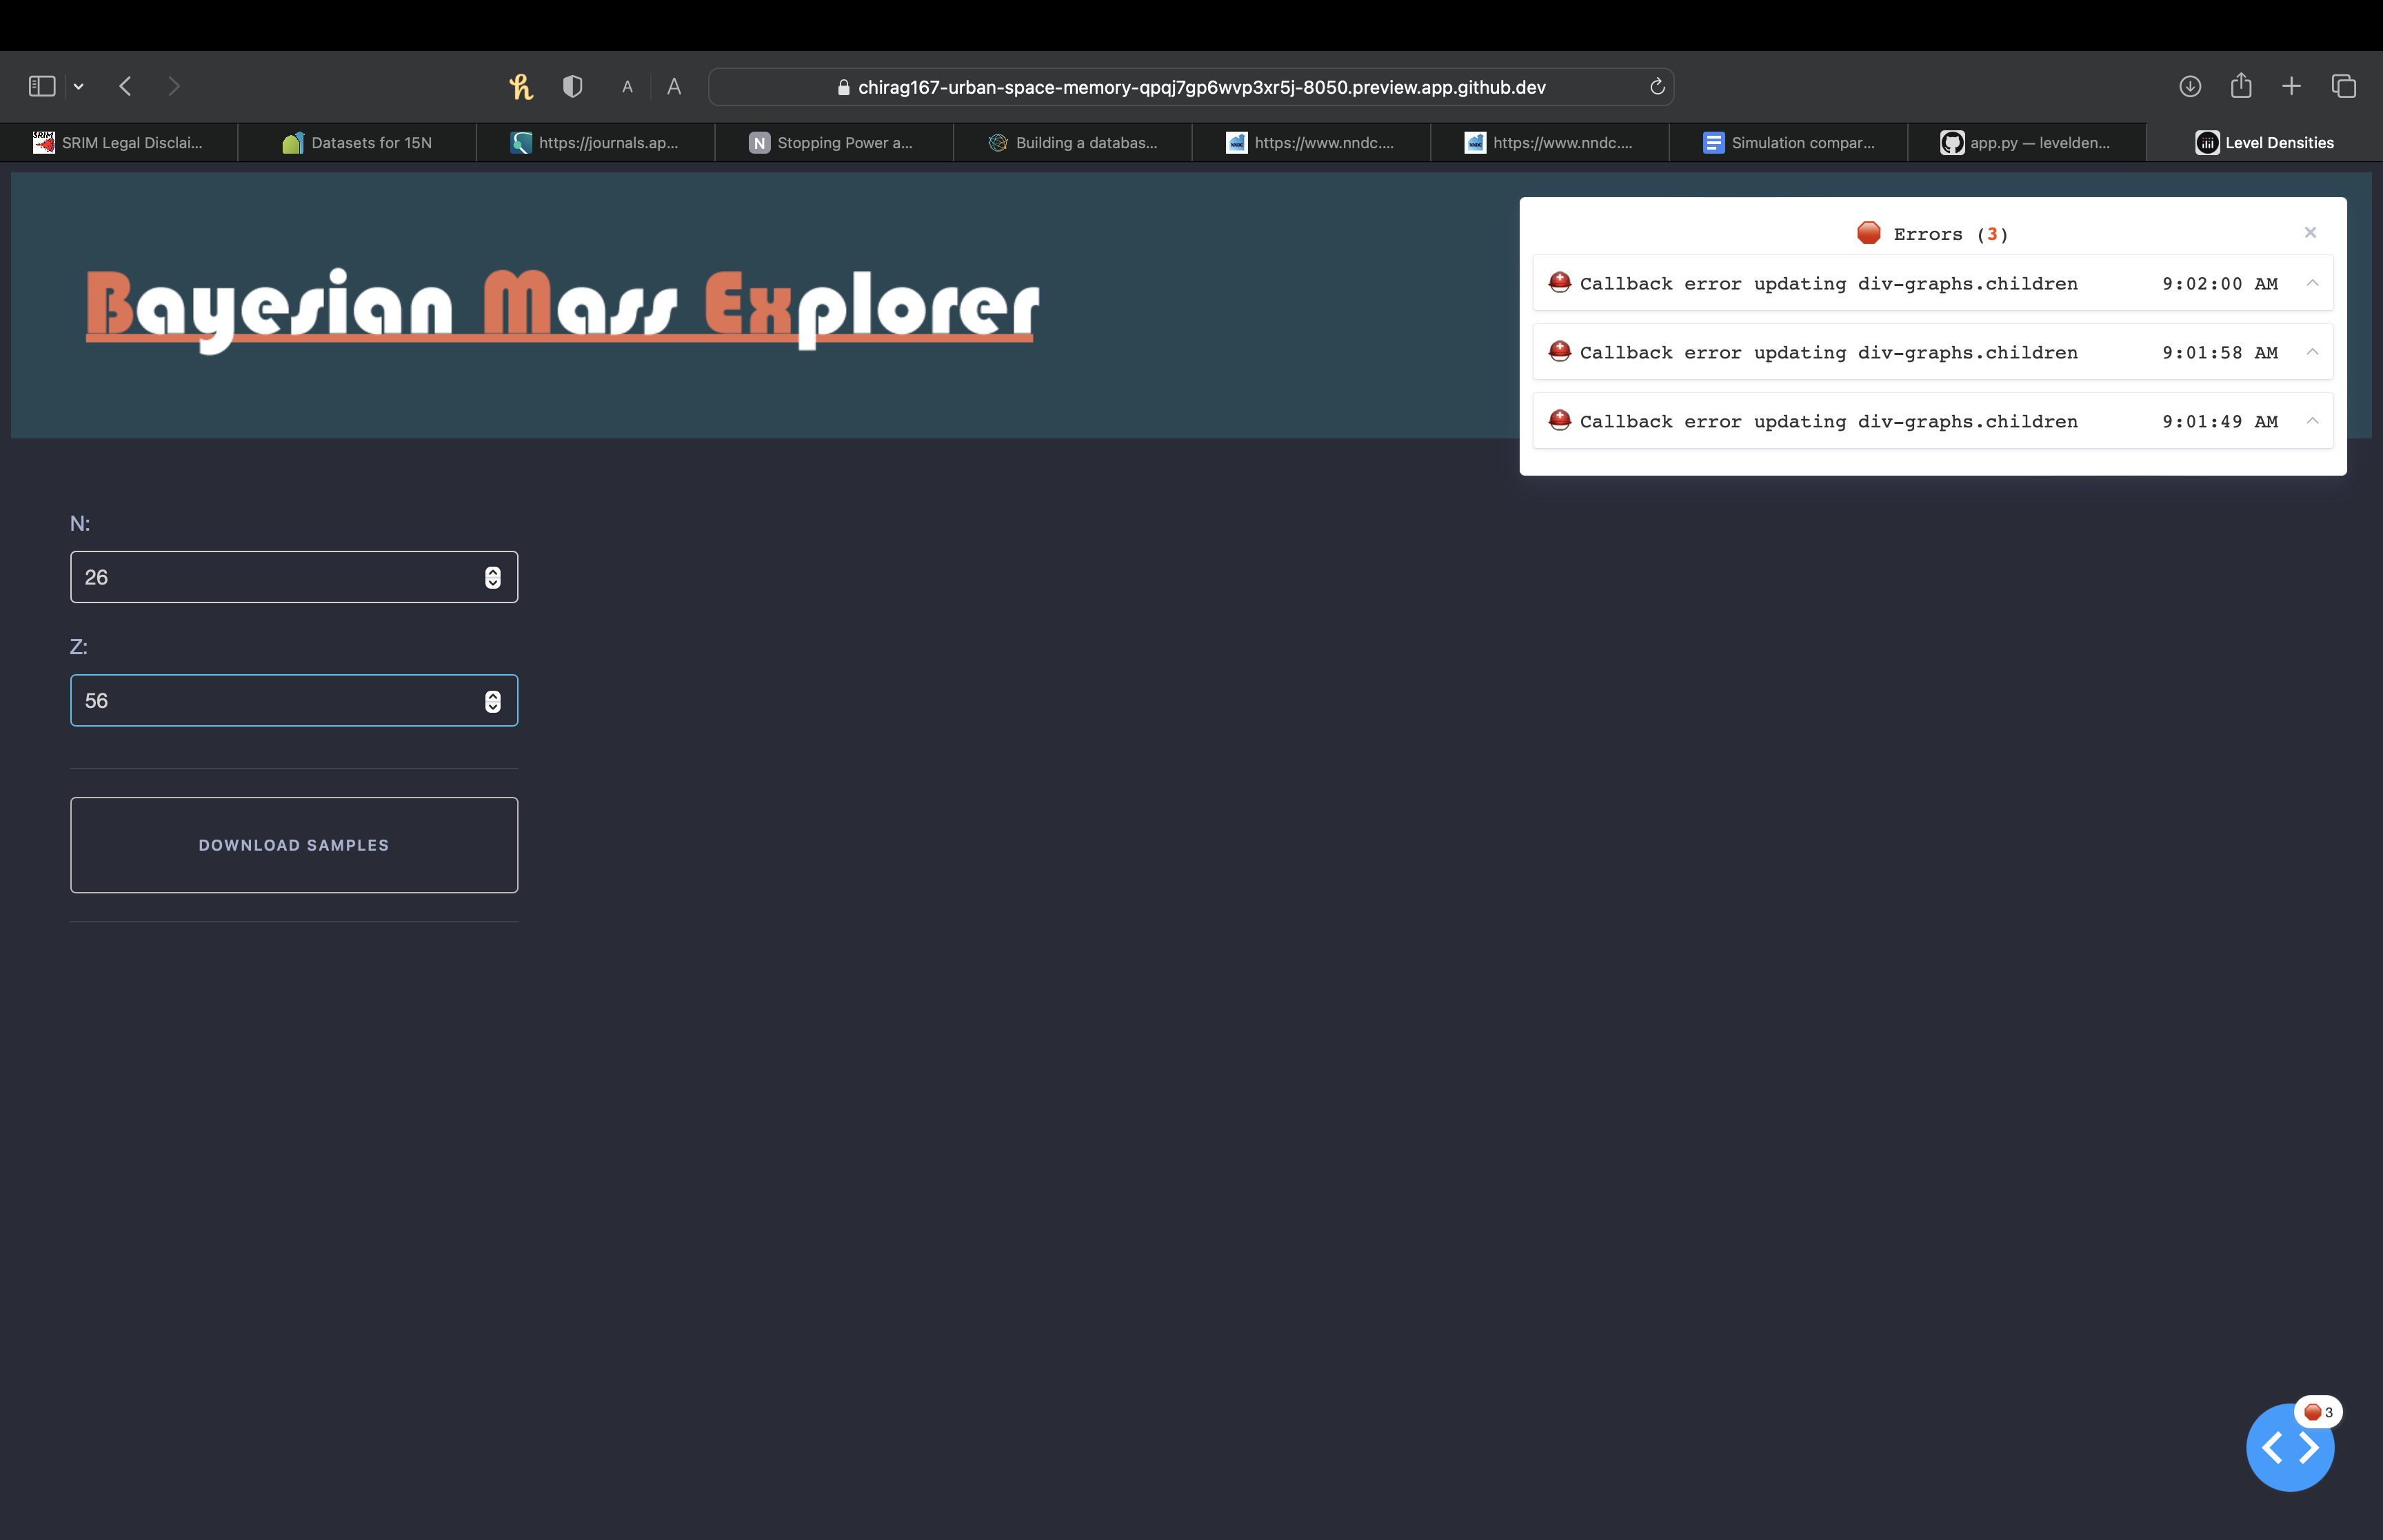
No, not exactly. When I tried to run the code again today, the website rendered but I get a bunch of callback errors. I have attached a screenshot of the error below.
I made the port public and re ran the application. Initially it wasn’t able to find the file in line 76 (Arranged_data.xlsx) and that was giving me errors. However, when I uploaded the Excel file, it wasn’t able to render it in Codespace because it is either binary or uses an unsupported text encoding. I ignored that warning and ran the application. On the website I am getting a call back error saying that I need to install openpyxl. I am not sure if I can get around without the installation because I was hoping that Pandas would read the Excel file for me.
Also, I uploaded a folder of a data set for testing (26_56) and I have changed the label neutron number (N) with mass number (A).
Are these recent changes? If so, did you push these changes to the github? I just see that it was updated 2 weeks ago.
Either way, we should be able to read in the file, we just might need to change the encoding or something if it’s really nonstandard. Any reason you can’t export as a CSV?
I made those changes today but I forgot to sync the changes after committing them. I have done that now and you should be able to view the updated version. Please let me know if that is not the case.
Also, I could import the data as a CSV file. There is no preference for one format over the other. I will try to import the data as a CSV file and see if that does the trick.
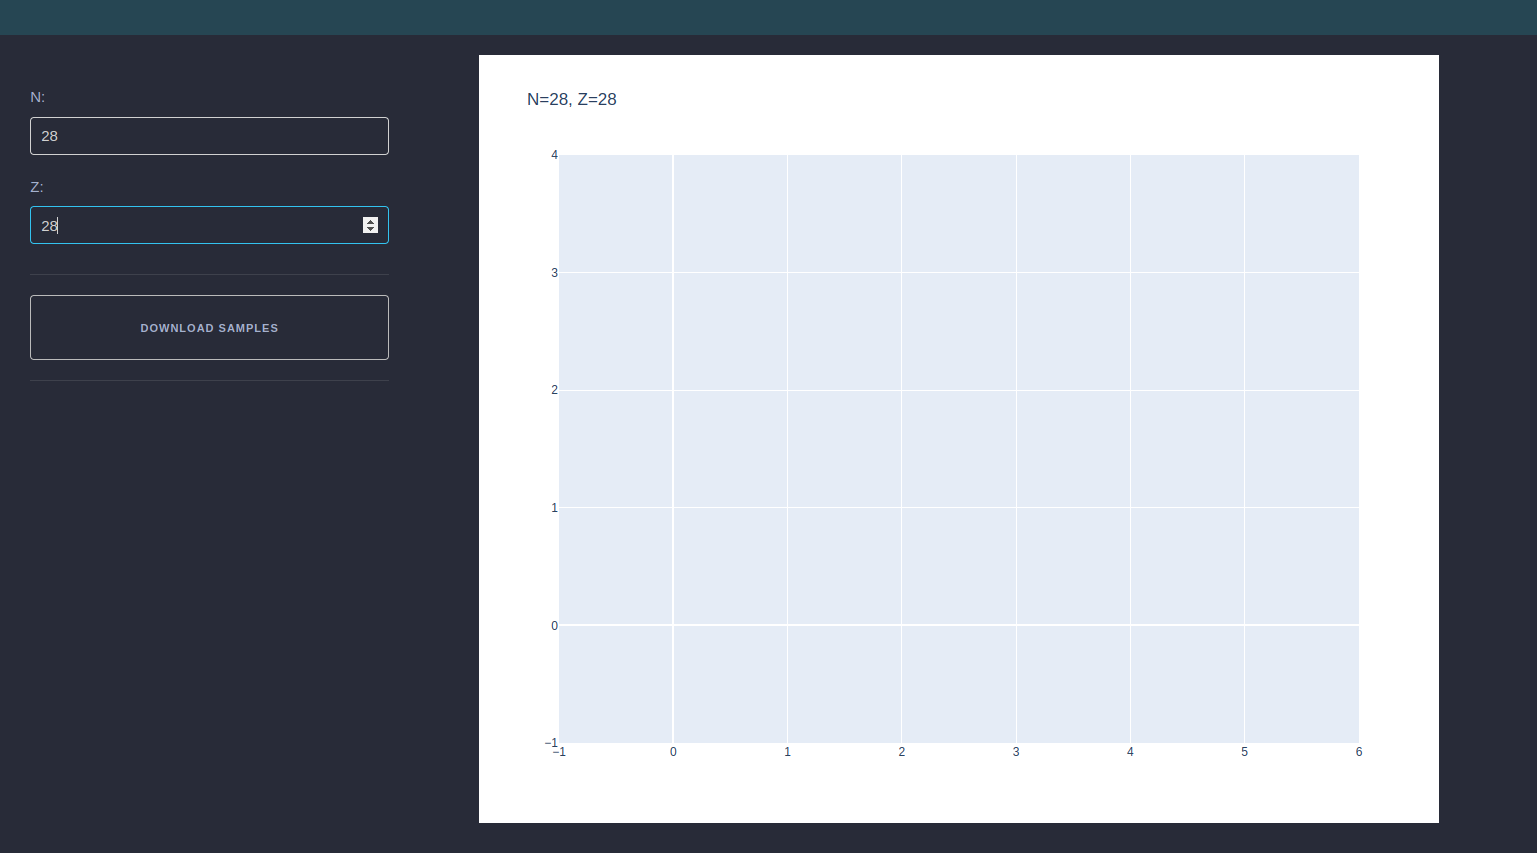
Hello. I used the CSV version of the file and it worked. I got rid of the Excel error and after a few more corrections I am at the point where I can input a mass number and proton number without any errors in my program. However, whenever I put in my test case (A = 56 and Z = 26), it displays nothing on the webpage. I believe I need to make some changes to the callback function (specifically the output) and maybe also the display_page() function for the program to display the data in a table.
Right now I am not trying to plot the data. I just want to display it. I would appreciate your help in this matter.
Sure! I’ve been travelling this week so I’ll take a look once I’m back and settled. Just be sure to keep the repository up to date so I’m looking at the newest version.
What do you want to display when the user inputs a nucleus? you could also draw, roughly, what you’d expect the page to look like. I’d be able to more easily set you on the path.
Hi Kyle! Apologies for the radio silence. I was caught up in other stuff and it slipped my mind to get back to you. So, in the past few months, I have created a new repository to build my website and it is current and up-to-date. So, right now the website takes in the mass number and the proton number as initial inputs. Based on that it lists all the available datasets belonging to that isotope. Once you enter its unique ID, it displays the data corresponding to that dataset. Further you can also plot and see how the data visually looks (on linear and log scale). In short I have the basics set up.
Something I want to work on next is adding a predictive bar (autocomplete predictions). So, as soon as the user starts typing the mass number, the scroll bar should appear and tell the user that mass numbers available closely (or exactly) matching to the user’s needs. I thought this would be a better idea than just listing all the mass numbers and proton numbers on the website. It would make it too messy. Right now this is the only way I can think of to handle this in a clean way. If you have a better suggestion, fire away!
Also, I would like to add a download button at the end of my website (below the plot). I will refer to your code to format the download feature and if I run into errors I will reach out to you. The address of the GitHub repo is: GitHub - chirag167/NLD_database_website
Please let me know if you have troubles viewing the up-to-date repo. I haven’t got the chance to spend a lot of time with GitHub codespace (apologies again!).
Which branch are you developing on? the master or the codespaces one? I was trying to play with it but I got a few bugs, I’ll try to look in more detail.
One cool way of interacting with available nuclei is the classic method of showing a nuclear chart! you can imagine clicking on your nucleus of choice and exploring the different datasets for it.
Regarding the autocomplete, I found some examples that maybe you’ve already seen:
I was developing on the codespaces branch. Is there a problem with that? In hindsight, I could have start developing on the master branch. But now, I could merge the branches. Do you think that would be a good idea moving forward?
Yes, I would love to display the nuclear chart on my website. However, I would need some more time to develop it in an interactive way. I recall that your website (BMEX) also displays and uses the nuclear chart, doesn’t it? I will look into it. Also, thank you for sharing the resources for autocomplete. I will have a look at them too.
Hi Kyle. So I went ahead and deleted the extra branch that was created (probably accidentally). Now the repository only has the main branch (keeping things simple and straight). I added drop down bars for the input mass numbers and proton numbers. The cool thing about these bars are they are interconnected, i.e., once the user inputs a mass number, the proton number menu bar will only show the proton number associated with that mass number. I am currently working on adding a functional download button.
Later I will work on adding an interactive nuclear chart. I think this is finally beginning to shape and make sense!
Very cool! A PhD student here put together a chart for a different project that has more interactivity and hovering if you want to get inspiration there:
It’s the same technology that you’re using and that we use in BMEX, but he added images on hover and such: http://shellmodel.ascsn.net/
Right now the version on the web is a bit broken and the interactivity doesn’t work, but maybe it’s how you’d like yours?
Yeah, I will take a look at it. It sounds very interesting to increase user-attraction to the website. Right now, I have added a download button at the bottom of the screen and at this moment it serves a dummy purpose. First I would like to make it functional and I am looking into how to do that.
@landonbuskirk might have some insights. We have one in the bmex-masses web app, so perhaps that implementation is what you’d like? It’s essentially triggering a callback and then prepares the download. In our case we make some PDFs and put them in a zip.
Implementation on BMEX simply uses the download component through dash. Documentation for downloading single files should be found completely here: Download | Dash for Python Documentation | Plotly. To download a zip of multiple files (in this case for downloading ploty figs as pdfs), our pseudo-code callback looks like this: